In this post I am going to show how to use a combination of RANKX() function and Power BI What-If parameters to analyse the customers’ monthly sales and find out the customers with the best, worst and medium sales growth. The formula I used for sales trend is margin of the current month sales amount to average sales amount during the last 12 months:
Customer Sales Trend= (Current month sales – Average last 12 months) / Average last 12 months
I want to show CustomerName and SalesTrend% in a table visual and able the end users to:
- Toggle between top and bottom customers.
- Change the number of the visible customers in the visual (top/bottom N customers)
- Change the percentage boundary to show the middle customers as well (e.g. from -100% to 100% , -70% to 70%)
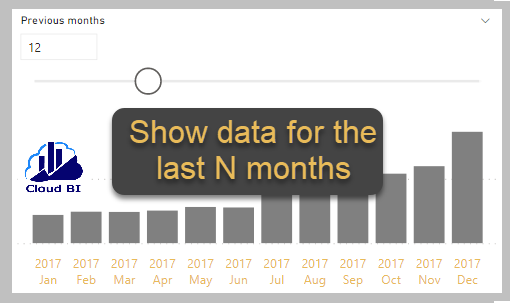
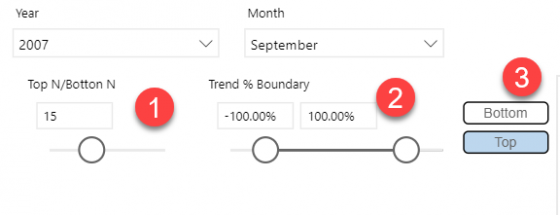
You can see the preview of all the above features below:

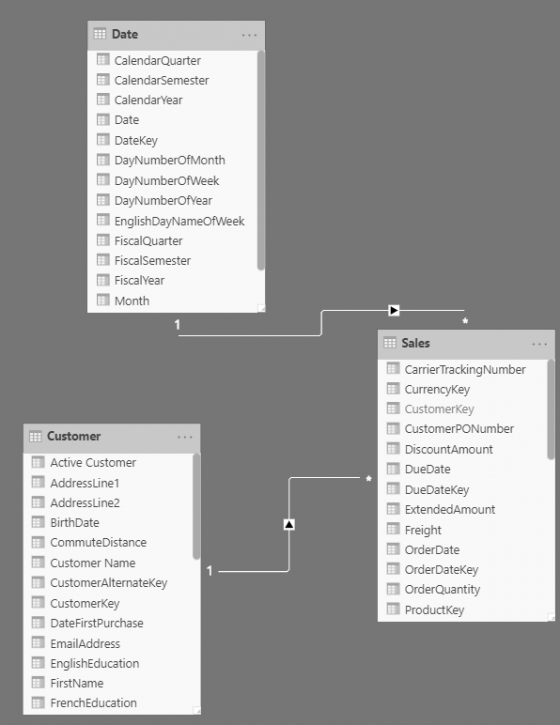
The model I used for this demo is a simple Sales dataset with 3 tables: Sales, Date and Customer:
First I created a measure to show monthly average of sales amount during the 12 months prior to the selected month by using AverageX and DatesInPeriod functions:
Sales Amount Avg L12M =CALCULATE(
AVERAGEX(VALUES('Date'[Month]),Sales[Sales Amount]) ,
DATESINPERIOD('Date'[Date],DATEADD(FIRSTDATE('Date'[Date]),-1,DAY),
-12, MONTH)
)
Then Sales Trend% can be calculated as margin of Sales Amount to the 12 months average:
Sales Trend% = DIVIDE(Sales[Sales Amount]-Sales[Sales Amount Avg L12M],
Sales[Sales Amount Avg L12M],
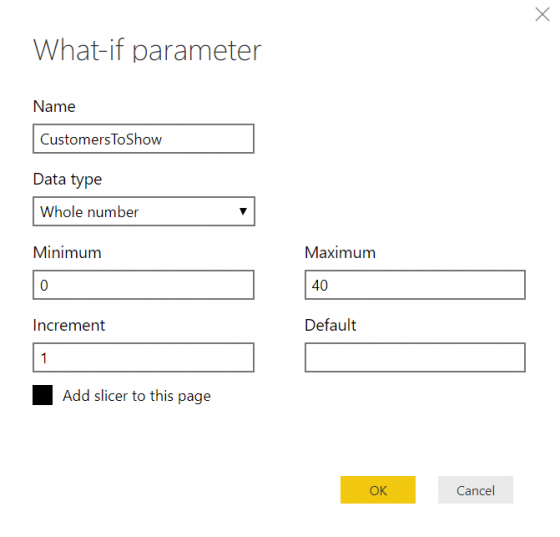
BLANK())We need to create two What-If parameters, one for selecting the number of visible customers:
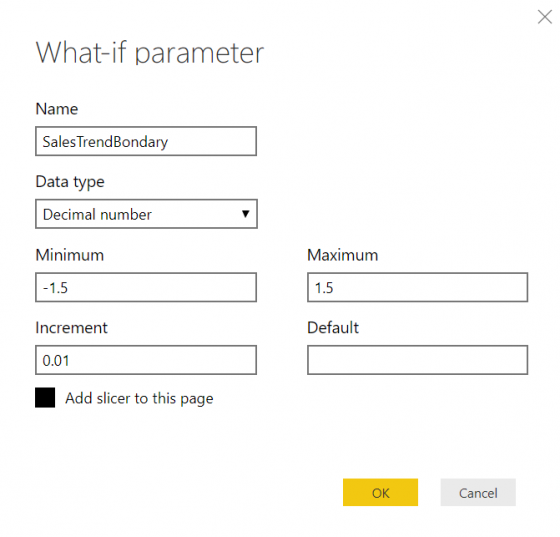
And one for changing boundaries of SalesTrend%:
We also need a table with one column and two rows to store Top and Bottom values which be used for toggling:
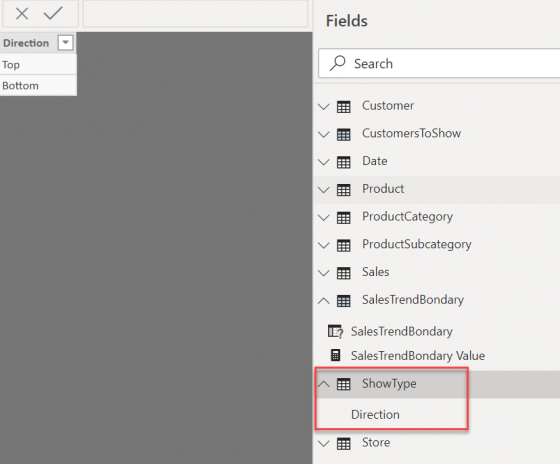
In the report we create 2 slicers for What-If parameters and a ChicleSlicer (this is a custom visual) for Top-Bottom based on Direction column in ShowType table:
Now it is the time for creating measures to give us Top/Bottom customers. I start with a simple formula and then evolve it step by step by including the parameters . The below DAX returns top 20 customers how have the highest sales trend:
Sales Trend% Top Customers =
CALCULATE (
Sales[Sales Trend%],
FILTER (
VALUES ( Customer[Customer Name] ),
RANKX (ALL ( Customer[Customer Name] ),Sales[Sales Trend%], , DESC) <= 20
)
)
I should mention the credit of the above formula goes to Sam McKay from Enterprise DNA.
By replacing 20 in the above formula with CustomersToShow[CustomersToShow Value], the number of visible customers will be changed dynamically based on CustomerToShow parameter:
Sales Trend% Top Customers =
CALCULATE (
Sales[Sales Trend%],
FILTER (
VALUES ( Customer[Customer Name] ),
RANKX (ALL ( Customer[Customer Name] ),Sales[Sales Trend%], , DESC)
<= CustomersToShow[CustomersToShow Value] )
)
And for showing the top customers in a selected sales trend percentage range, Customer[Customer Name] must be filtered inside RANKX and also in the result set:
Sales Trend% Top Customers =
CALCULATE (
Sales[Sales Trend%],
FILTER( VALUES ( Customer[Customer Name] ),
RANKX (
FILTER (
ALL(Customer[Customer Name] ),
Sales[Sales Trend%] >=MIN('SalesTrendBondary'[SalesTrendBondary] )
&& Sales[Sales Trend%] <= MAX ( 'SalesTrendBondary'[SalesTrendBondary] )
),Sales[Sales Trend%], , DESC )
<= CustomersToShow[CustomersToShow Value] &&
Sales[Sales Trend%] >= MIN ( 'SalesTrendBondary'[SalesTrendBondary] ) &&
Sales[Sales Trend%] <= MAX ( 'SalesTrendBondary'[SalesTrendBondary] )
)
)
Now we need to create another measure for bottom customers. The new measure is similar to the above measure just in RANKX function DESC should be replaced by ASC:
Sales Trend% Bottom Customers =
CALCULATE (
Sales[Sales Trend%],
FILTER( VALUES ( Customer[Customer Name] ),
RANKX (
FILTER (ALL(Customer[Customer Name] ),
Sales[Sales Trend%] >=MIN('SalesTrendBondary'[SalesTrendBondary] )
&& Sales[Sales Trend%] <= MAX ( 'SalesTrendBondary'[SalesTrendBondary] )
),Sales[Sales Trend%], , ASC )
<= CustomersToShow[CustomersToShow Value] &&
Sales[Sales Trend%] >= MIN ( 'SalesTrendBondary'[SalesTrendBondary] ) &&
Sales[Sales Trend%] <= MAX ( 'SalesTrendBondary'[SalesTrendBondary] )
)
)
Then create a measure to switch between top and bottom measures based on ShowType[Direction] value:
Sales Trend% Customer = IF(SELECTEDVALUE(ShowType[Direction])="Top",
Sales[Sales Trend% Top Customers]
,Sales[Sales Trend% Bottom Customers])
And finally the calculations are completed. [Customer Name] and [Sales Trend% Customer] are added to a table visual and by using the slicers we can explore top, bottom and average customers of the month: