What is Calculation Group
Calculation group is a new DAX feature introduced in SSAS 2019 where it creates generic DAX formulas in the model and uses them for different measures in the reports. For example time series calculations such as MTD(month to date), YTD(year to date), same period in previous year are very popular and usually are required to be created for most of the measures. By creating these measures for any numeric metrics( such as sales, orders, refund,…) we will end up with too many measures which take a lot of development time and make the model pilled up with many measures. Instead of creating measures for each metrics, the formula can be created once in a Calculation Group and then be used in the reports for the multiple measures.
Simple Demo in Power BI Desktop
The below demo helps to have a better understanding of how Calculation Group works. A Calculation group has been created for time intelligence calculations and it is used along with different measures.
Requirements to create Calculation Group
At this time Calculation Group is only available in SSAS 2019 and the below items are required for creating Calculation Groups :
- SSAS on SQL Server 2019 or Azure
- Microsoft Visual Studio 2019
- Microsoft Analysis Service Project extension for VS 2019
How does it work
Calculation Group is based on the 4 new DAX functions. The most important function is SELECTEDMEASURE which is used by calculation items to reference the measure that is currently in context (SalesAmount, Product Price and Profit in my demo).The other DAX functions introduced for Calculation Group are:
- SELECTEDMEASURENAME – Determines name of the measure that is in context.
- ISSELECTEDMEASURE – Determines whether measure that is in context is specified in a list of measures.
- SELECTEDMEASUREFORMATSTRING – Returns the format string of the measure that is in context.
Creating a Calculation Group Step by Step
Here I am going to create a simple calculation group to show part of the whole of any product attributes to all products. For example to show what is the percentage of sales for each product category of all products’ sales.
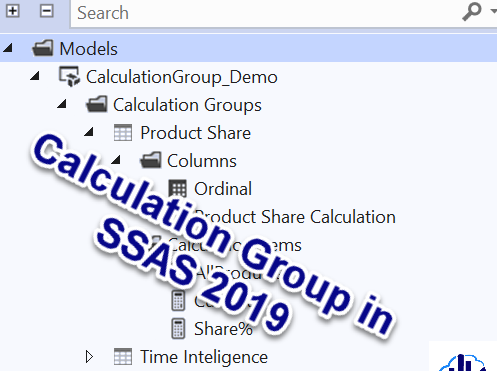
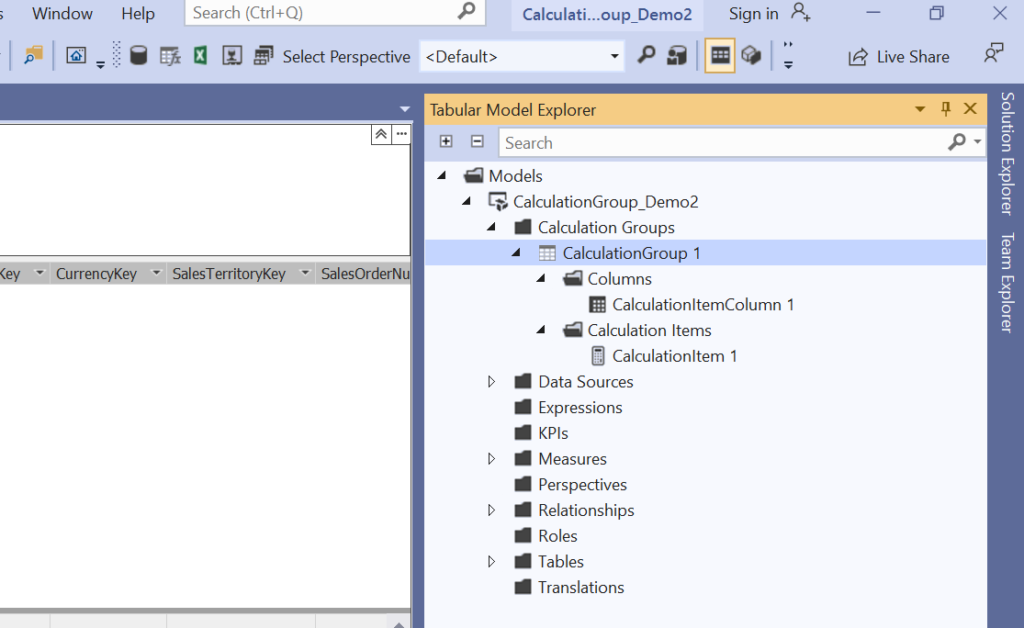
If you create a new Analysis Services Tabular Project in VS 22019, in Tabular Model Explorer will see a new section been added for Calculations Groups:
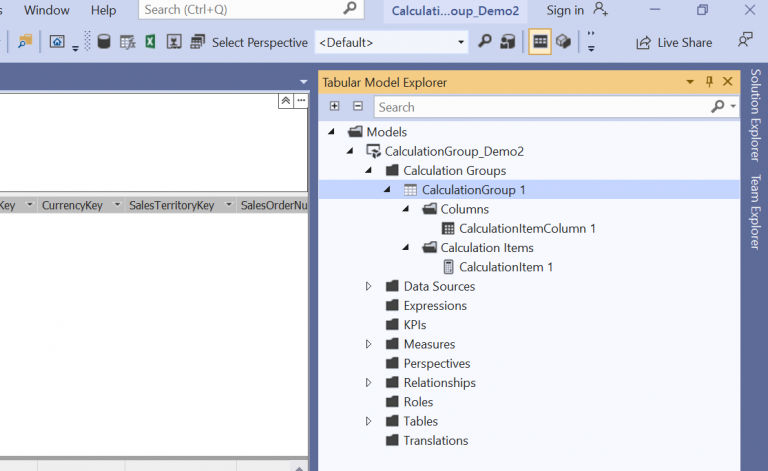
By creating a new Calculation Group you will see 2 sections under the Calculation Group:
- Columns – Here normally one column is required to be used in the report for referring to the calculation group.
- Calculation Items – One or multiple DAX formulas will be defined here which will be used by different metrics in the reports.
Let’s give the proper name to the default Calculation Group, Column and Items (you can do this from Property panel as there is no direct rename is available now) :
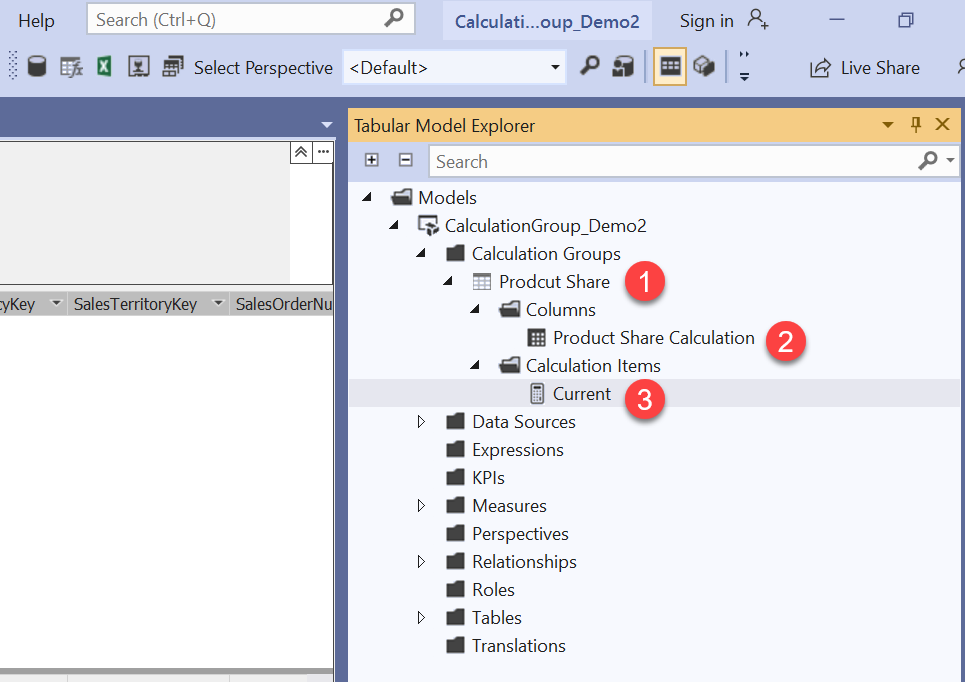
- Current – To show the measure for any product attribute which is in filter context:
SELECTEDMEASURE()- AllProducts – To show the measure aggregated for all of the products regardless of filter context:
Calculate(SelectedMeasure(),All('Product'))- Share% – To show part of whole of the measures:
Divide( CALCULATE(
     SELECTEDMEASURE(),
       'Product Share'[Product Share Calculation]="Current"
  ),
CALCULATE(
       SELECTEDMEASURE(),
       'Product Share'[Product Share Calculation]="AllProducts"
  )
    )
Notice for Share% we have used the other 2 calculation items in DAX by filtering ‘Product Share'[Product Share Calculation] in Calculate. Basically it is assumed that Product Share is a table ,Product Share Calculation is a column and Current and AllProducts are values for this column.
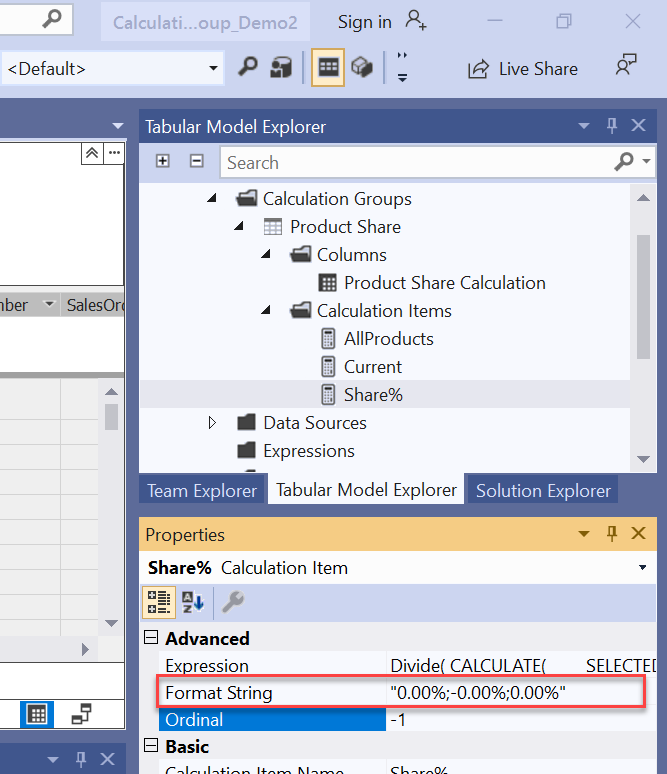
Setting data format
We let the data format for Current and AllProduct to be inherited from the measures by leaving it blank but for Share% explicitly define the format to be percentage.
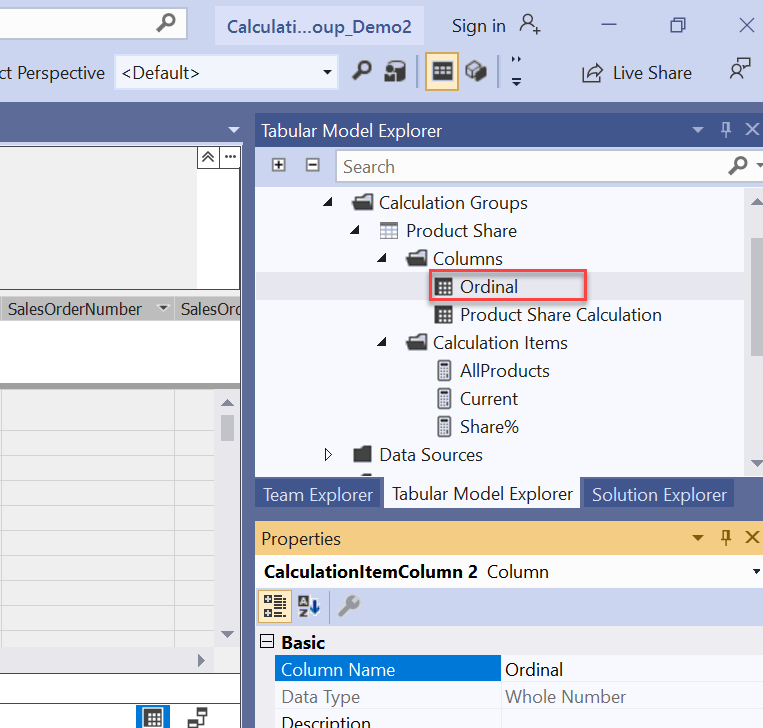
Ordering
By default calculation items are sorted alphabetically in the report but we are able to define the order.First create a new column and name it Ordinal.
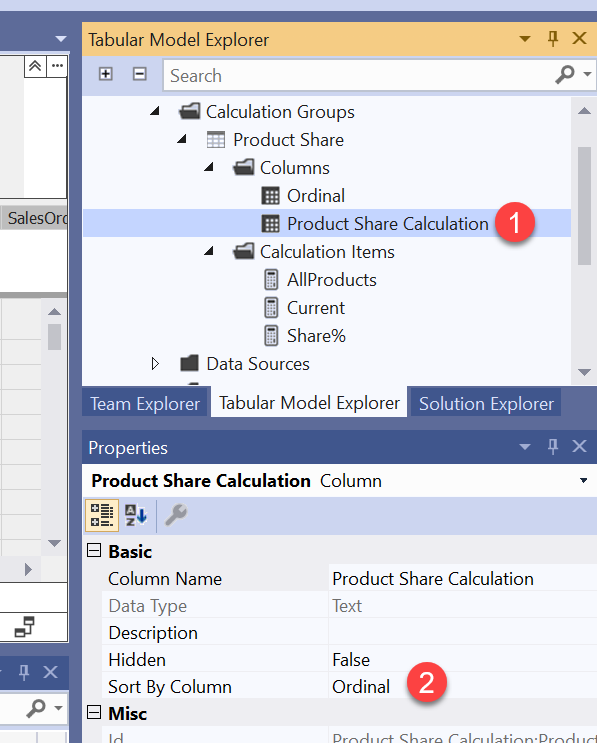
Then select the main column and set Sort By Column to Ordinal column:
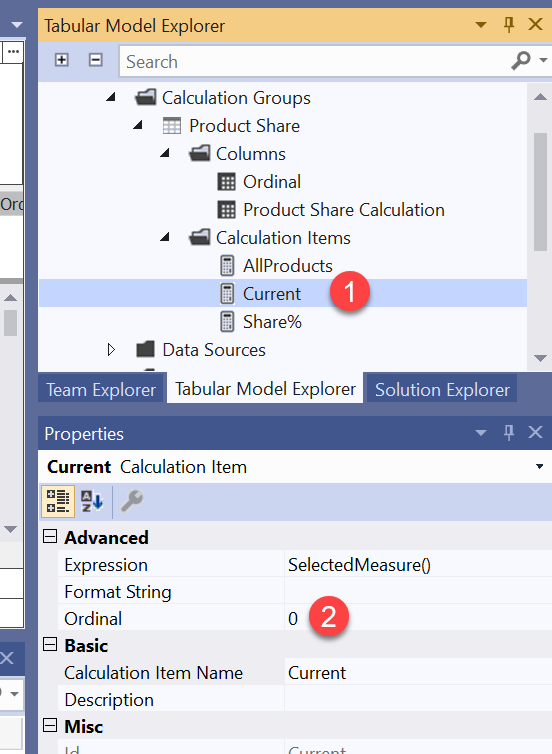
And then for each calculation items set Ordinal to an unique number greater than or equal to zero:
Now after deploying the model and processing the calculation group you should be able to use it for different measures in a Power BI Desktop as can be seen in the below demonstration:
Limitation
- Implicit measures – Calculation Group can only be used with Explicit measures( measures been created in SSAS or Power BI Desktop) and doesn’t work with Implicit measures(aggregating columns).
- Object level security – OLS defined on calculation group tables is not supported. However, OLS can be defined on other tables in the same model. If a calculation item refers to an OLS secured object, a generic error is returned.
- Row level security – RLS is not supported. Define RLS on tables in the same model, but not on calculation groups themselves (directly or indirectly).
- Detail Rows Expressions – DRE are not supported with calculation groups.
Summary
Calculation Group is a big improvement in DAX which was introduced in SSAS 2019. By Calculation Group some popular DAX calculations can be defined as generic and be used in the reports by different measures that reduce the development time and makes the model light and clean.