In my previous post here I explained Calculation Groups and how to create them in SSAS. After that I have started exploring Calculation Group in more detail and intend to post more blogs about different use cases for Calculation Group in the reports.
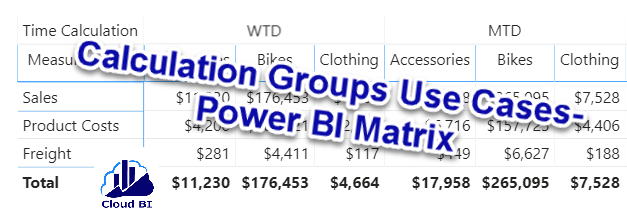
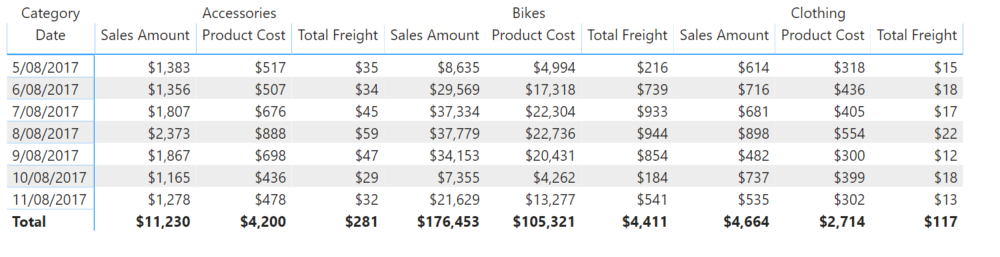
There is a limitation in Power BI Matrix when you want to use measures as an attribute. To better understand in the below screenshot the 3 measures Sales Amount, Product Cost and Total Freight have been used in a matrix which has Product Category on columns and Date on rows:
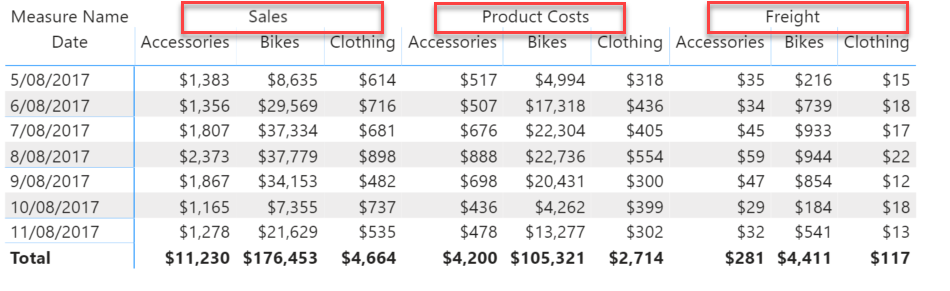
But if we want to change orders of the columns in a way that measures have more priority than Product Category (similar to the below image), there is no out of the box setting in Power BI matrix visual.
One work around for this is creating a one column table that has one row for each measure name and then create a measure and use Switch Case to show one of the measures based on the selected measure name in the table.
Now we are going to see how Calculated Measure can help to sort this out. We just need to create a calculated group, and for each measure create a Calculation Items.
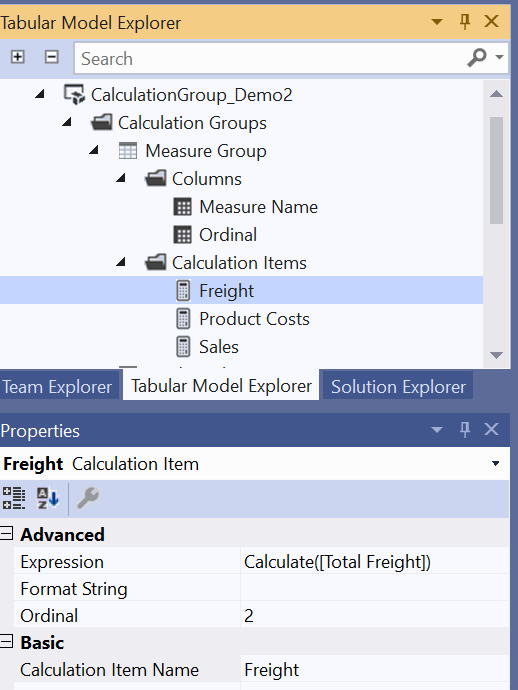
DAX formula for each of the Calculation Items simply would be CALCULATE(measure). In our example the Calculation Items will use the below DAX formula:
- Sales – CALCULATE([Sales Amount])
- Product Cost – CALCULATE([Product Cost])
- Freight – CALCULATE([Total Freight])
Then will give an Ordinal value to each of the Calculation Items to determine the order of the column in the matrix (0 to Sales, 1 to Product Cost and 3 to Freight).
After deploying the cube and processing the calculation table, I will get back to Power BI to create the matrix.First add Measure Name from the calculated group into the columns above Product Category. After that I need to add a measure to the Values part, this measure can be any measure just to enable the calculation group as the values come from the calculation items regardless of this measure. And ultimately by expanding all down one level in hierarchy we can see the values categorised by measure names then product category:

We can replace product category with Time Intelligence calculation group which have created in the previous post to have more insight over the data:

In another way, we can have one of one calculator group in Rows and another one in Columns to provide a different view of the data: