BI
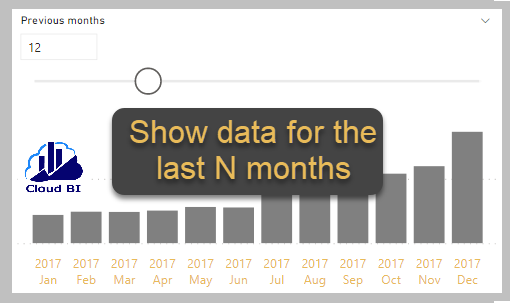
Show data for the last N months based on a selected month
Power BI doesn’t have out of the box features to cover all of the UI use cases and occasionally we need to use our DAX

Power BI doesn’t have out of the box features to cover all of the UI use cases and occasionally we need to use our DAX
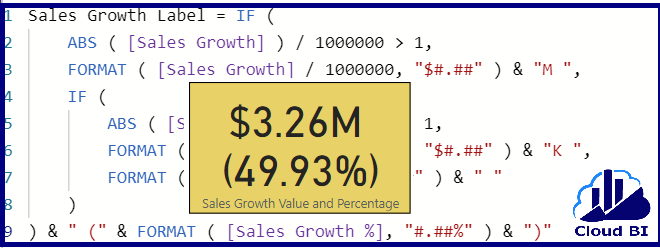
In most of the reports, it is a very popular requirement to show the growth value and percentage of metrics over a period of time. In Power BI, the
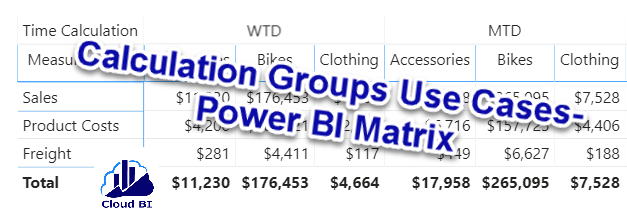
In my previous post here I explained Calculation Groups and how to create them in SSAS. After that I have started exploring Calculation Group in more detail
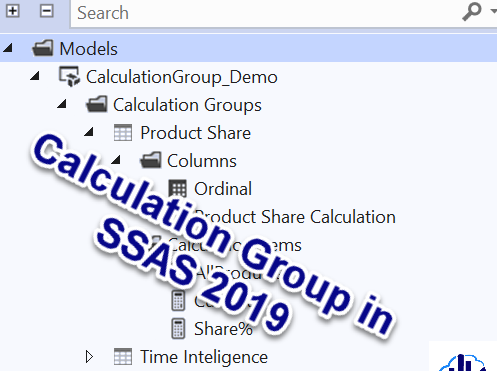
What is Calculation Group Calculation group is a new DAX feature introduced in SSAS 2019 where it creates generic DAX formulas in the model and
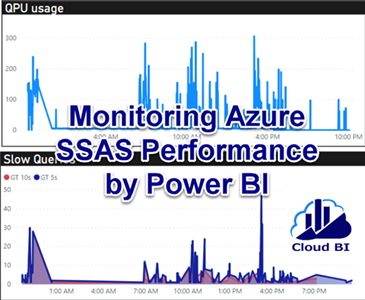
An important part of any data source system is monitoring when the admins can check the health of the system and be aware of consumption

In this post I am going to show how to use a combination of RANKX() function and Power BI What-If parameters to analyse the customers’
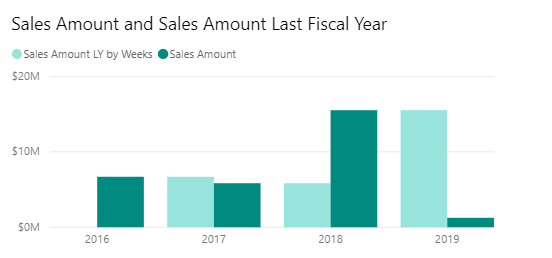
Although calculating year to year growth simply can be done by using DAX formulas such as SamePeriodLastYear() or DateAdd(), but for some business that tracking