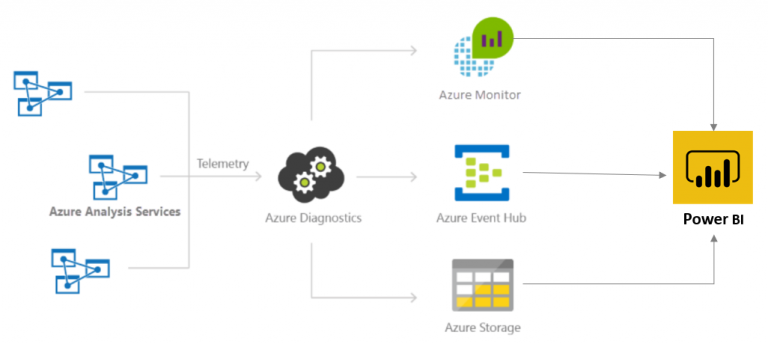
An important part of any data source system is monitoring when the admins can check the health of the system and be aware of consumption rate. In Azure Analysis Service the queries, events and consumption metrics can be logged by enabling Azure Diagnostics. Although there are some out of the box graphing features in Azure portal to plot the logs, we can use Power BI to connect to this log data and then create customized reports for monitoring the system.
The log data can be submitted into one of the below items which all are accessible by Power BI:
- Archive to a storage account.
- Stream to an event hub
- Send to Azure Monitor (Log Analytics workspace).
In this post I will show how to enable SSAS log diagnostics on Log Analytics workspace and how to create Power BI report for monitoring and troubleshooting.
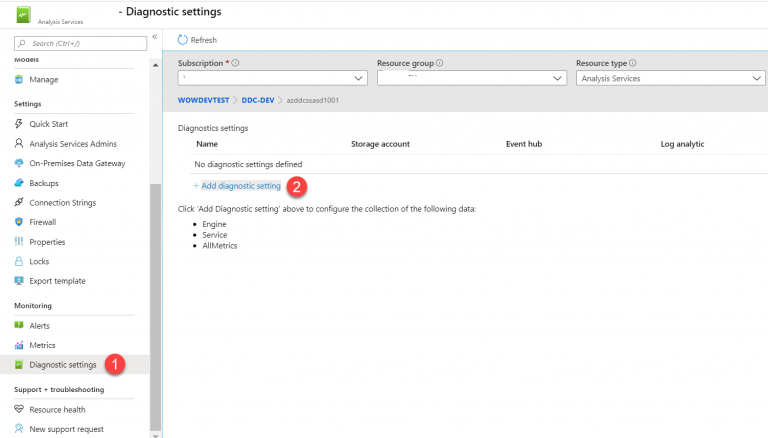
Setup Diagnostics on SSAS server
In Azure portal go to SSAS server and select Diagnostics settings and click on Add diagnostics settings:
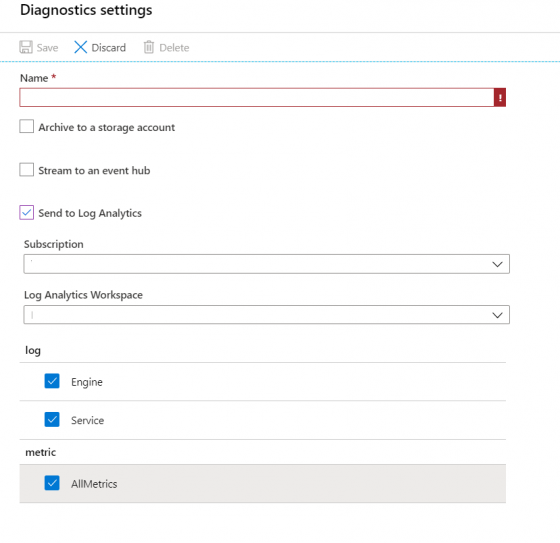
Give it a name, select Send to Log Analytics, choose a predefined Log Analytics workspace and tick the boxes for Engine, Service and AllMetrics then click on Save.
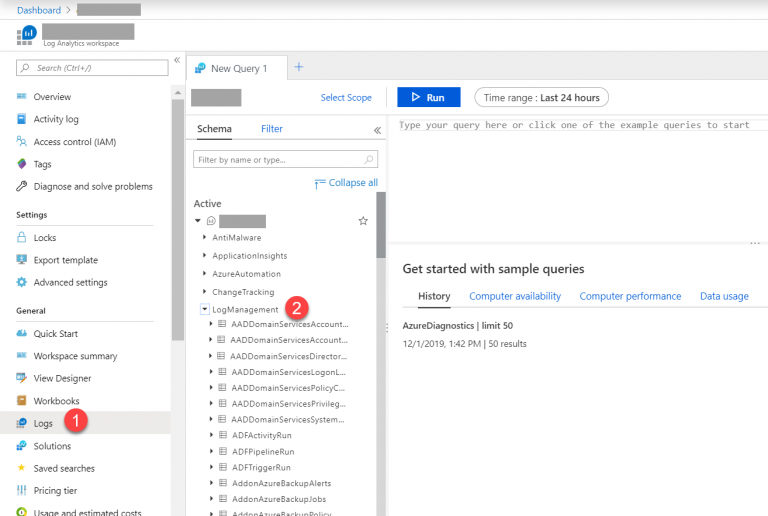
Run query on Log Analytics
Open the Log Analytics workspace then select Log from the left panel and then in the query builder expand LogManagement and select AzureDiagnostics:
Change the MyServerName in the below query and paste it to the query builder and run it. The result shows QPU and memory consumption per minute during the past 24 hours:
let window = AzureDiagnostics

   | where ResourceProvider == "MICROSOFT.ANALYSISSERVICES" and Resource =~ "MyServerName";

window

| where OperationName == "LogMetric"

| where name_s == "memory_metric" or name_s == "qpu_metric"

| project ServerName_s, TimeGenerated, name_s, value_s

| summarize avg(todecimal(value_s)) by ServerName_s, name_s, bin(TimeGenerated, 1m)

| order by TimeGenerated asc 
To see the queries been running on the server change MyServerName and MyDatabaseName in the below query then paste and run it. This one return detailed information such as UserId, elapsed time, application name and also the DAX query.
let window = AzureDiagnostics

   | where ResourceProvider == "MICROSOFT.ANALYSISSERVICES" and Resource =~ "MyServerName" and DatabaseName_s =~ "MyDatabaseName" ;

window

| where OperationName has "QueryEnd" or (OperationName has "CommandEnd" and EventSubclass_s == 38)

| where extract(@"([^,]*)", 1,Duration_s, typeof(long)) > 0

| extend DurationMs=extract(@"([^,]*)", 1,Duration_s, typeof(long))

| project  StartTime_t,EndTime_t,ServerName_s,OperationName,RootActivityId_g,TextData_s,DatabaseName_s,ApplicationName_s,Duration_s,EffectiveUsername_s,User_s,EventSubclass_s,DurationMs

| order by StartTime_t asc
Create Power BI Report
The queries created in the previous step can be converted to M query and be used in Power BI. Click on Export and choose Power BI to download a text file containing the query converted to M query.

Open the text file, leave the comments on top and copy the M query. Then in Power BI Desktop Go to Power Query and create a blank query.
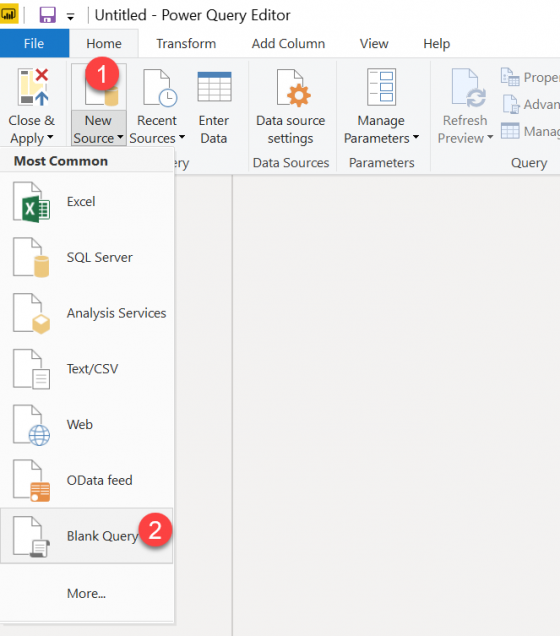
Go to Advanced Editor and paste the M query there.

Repeat this for the second query and give a proper name to the tables.

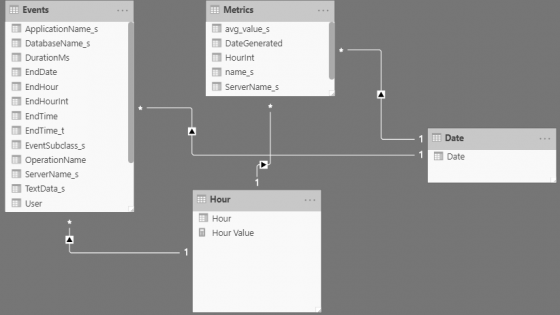
Add some transformation steps in Power Query to create columns with date and hour values based on datetime columns in both tables, then add 2 tables for Date and Hour and link them to the main tables.
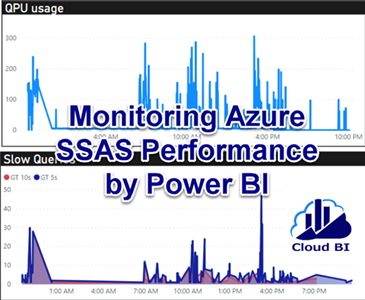
Now you can add date and hour slicers and create some charts to monitor QPU and memory usage and find out the times when there were more pressure on the server and understand the contributing factors .

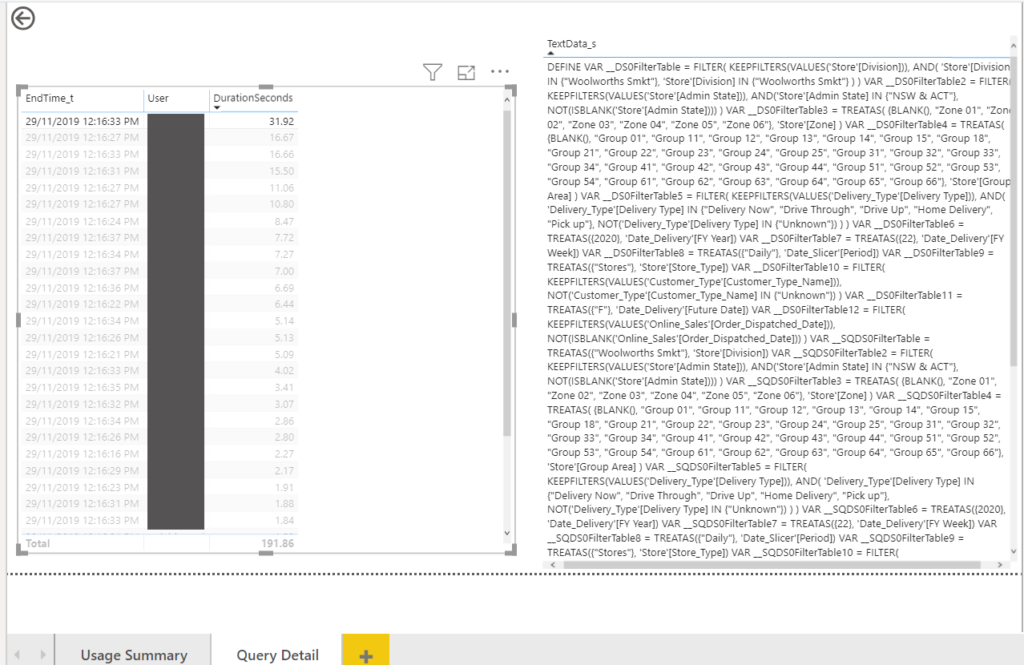
I defined a drill through page named it Query Detail which can be reached from the main page. This is particularly useful for investigating where there is a high pick in the graphs and to find out the users,applications, queries’s detail and DAX formula running at those times.

Summary
By enabling diagnostics in Azure SSAS the server’s events, queries and metrics can be logged and stored in a blob storage, submitted to Event Hub or sent to a Log Analytics workspace.
Power BI can connect to these data sources and use the log data for creating reports to help us monitoring the server and finding out the slow DAX queries.