Power BI doesn’t have out of the box features to cover all of the UI use cases and occasionally we need to use our DAX skills to keep the costumers happy. A case which I recently asked by a client was graphing a measure for the number of months in the way the user be able to select the end month and change the number of the months . Here I am going to share the way I implemented this with you.
For this practice I use a simple data model with 2 tables Sales and Date which have a linke to each other:

First I create a calculated table as a copy of the Date table and call it Date_Helper and link it to Sales table:


Then create a What If parameter and use it in a slicer:


Now create a new measure to show only the sales values which are on the selected month range:
Sales N last Months =
VAR toDate =
    MAX ( 'Date'[Date] )
VAR fromDate =
    EDATE ( toDate, -1 * 'Previous months'[Previous months Value] ) + 1
RETURN
    CALCULATE (
        Sales[Sales Amount],
        ALL ( 'Date' ),
        DATESBETWEEN ( Date_Helper[Date], fromDate, toDate )
    )
In the above DAX first keep the last day of the selected month in toDate variable then by using EDATE function, you get the last day of the previous N month and when it is added by 1, the first day of n-1 month is stored in fromDate variable. For example, if the selected month is Jun 2021 and N is 6, toDate will be 30 Jun 2021 and fromDate will be 1 Jan 2021.
In Calculate function the context filter from Date table is ignored by ALL(‘Date’) and by using DATESBETWEEN, Date_Helper is filtered between the intended date range.
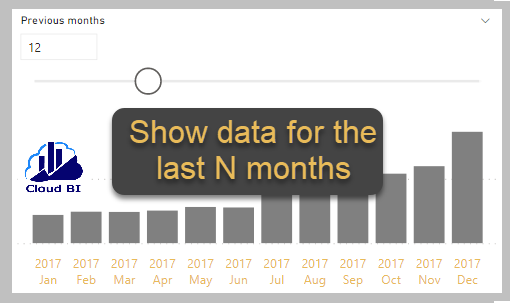
I need to add 2 slicers for Year and Month from Date table and then the last step is creating a bar chart by using YearMonth from Date_Helper and the new measure:

Now you can select a month and see how the chart is changed by selecting different number from Previous Months parameters:

Summary
For dynamically showing a measure for number of months before a selected month we used 2 Date tables, one for the year and month slicer and another one for the chart X axis. Then used DAX and created a new measure to show the value when it is in the selected month range.