Although calculating year to year growth simply can be done by using DAX formulas such as SamePeriodLastYear() or DateAdd(), but for some business that tracking their metrics on weekly base a different approach is required. In this post I explain how to demonstrate year on year growth on weekly base.
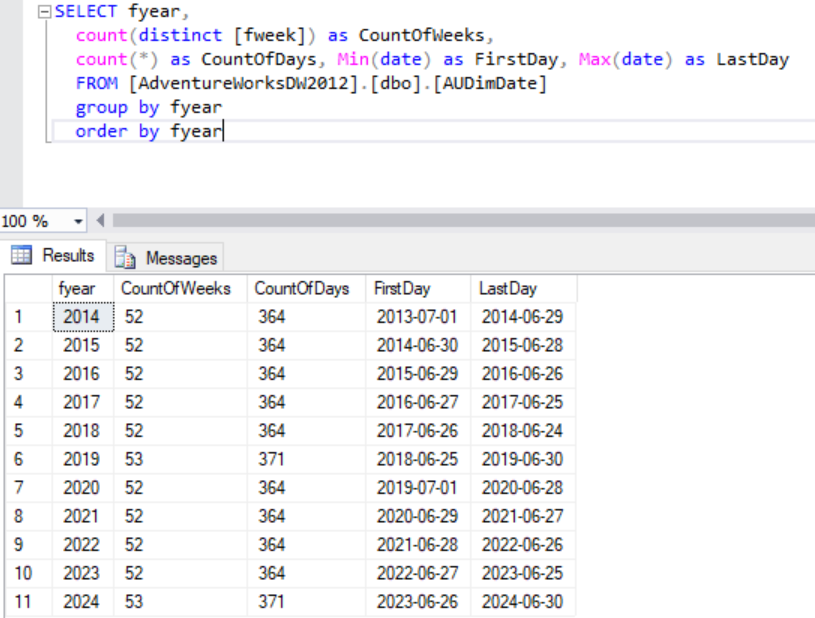
First we need to understand how the fiscal years can be split into weeks. Different countries have different start and end dates for their fiscal year. The country I discuss about it in this post is Australia that the fiscal year is from 1st of July to 30th June next year.
As dividing the number of days in a year(365) to the number of days in a week(7) gives 52 whole weeks and 1 day as remainder, the first year will be from July 1 to June 29, gets 52 weeks and passes 1 day to next year. The second year is from June 30 to June 28 , gets 52 weeks and passes 2 days to the following years. Considering there are 366 days in the leap years, the 6th or 5th year will have 371 days that is 53 weeks.So we will have 5 or 6 years (depends on how many leap years will be in the date range) with 52 weeks and one year with 53 weeks as below:
Obviously Date table must be customised by a sql script to include the above logic that is not in the scope of this post.
To create a demo report in Power BI w need to have a fact table linked to our Date dimension.Here I have used InternetSales table from AdventureWork database:

First let create a measure for last year sales amount based on SamePeriodLastYear():
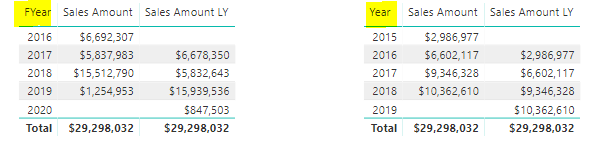
Sales Amount LY = CALCULATE(Sales[Sales Amount],SAMEPERIODLASTYEAR('Date'[Date]))As expected this measure works fine when date table is filtered by calendar year but for fiscal year the values don’t match:
A different formula is needed here to calculate the metric at weekly level and then aggregate it to yearly.The below DAX formula gives the sales amount for the same week of the last year:
Sales Amount LY by Week =
 var TY=SELECTEDVALUE('Date'[FYear])
 var TW=SELECTEDVALUE('Date'[FWeek])
 return
 CALCULATE(Sales[Sales Amount],
 FILTER(All('Date'),
         'Date'[FYear] = TY -1 && 'Date'[FWeek]=TW))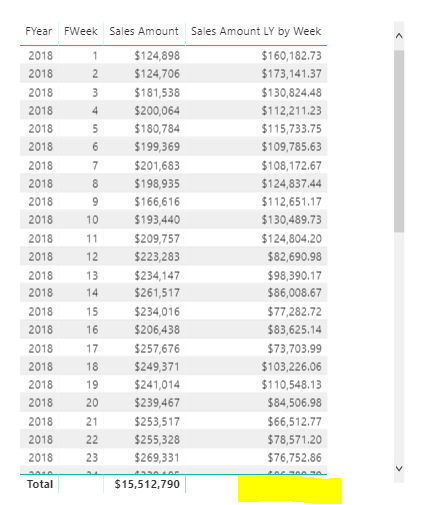
As you can see the sales amount of last year for each week is correct but the total value is blank and also when FWeek column is removed from the table the measure will be blank:

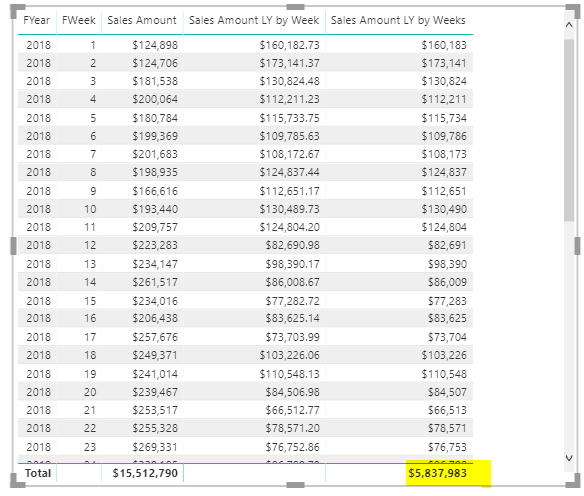
This behaviour is due to using SELECTEDVALUE() for FWeek in the formula that expects to have a single value of FWeek. Using VALUES() instead of SELECTEDVALUE() gets the existing weeks in a date range even without having FWeek as a filter:
Sales Amount LY by Weeks =
 var TY=SELECTEDVALUE('Date'[FYear])
 var Weeks=VALUES('Date'[FWeek])
 return
 CALCULATE(Sales[Sales Amount],
                       FILTER(All('Date'),
                         'Date'[FYear] = TY -1),
       Weeks)
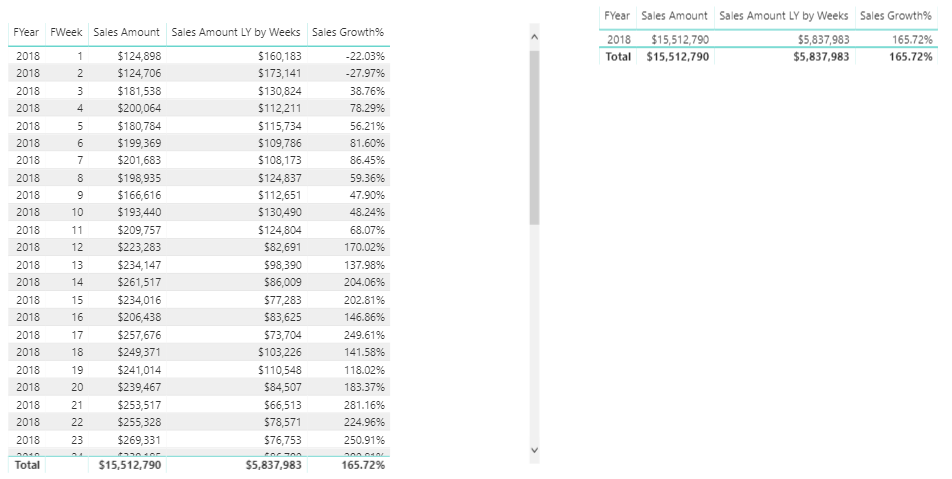
This change fixes the total issue and also the correct values for can be seen on year level:
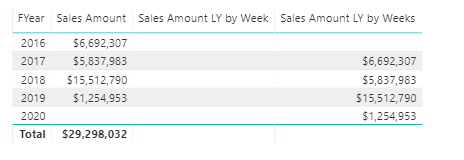
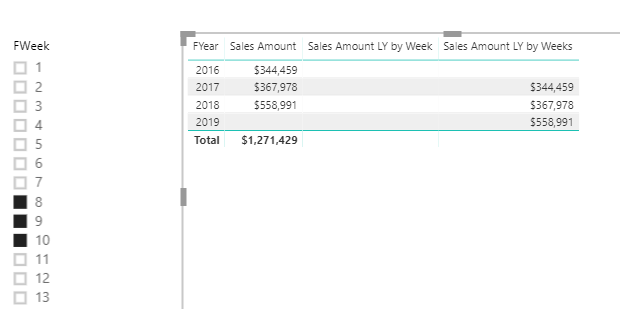
By this measure, you can also select a range of weeks and see the last year amount for them without including FWeek in the visual:
Now we can calculate year on year growth:
Sales Growth% = if(ISBLANK(Sales[Sales Amount]),BLANK(),
         DIVIDE(Sales[Sales Amount]-Sales[Sales Amount LY by Weeks],
               Sales[Sales Amount LY by Weeks]))